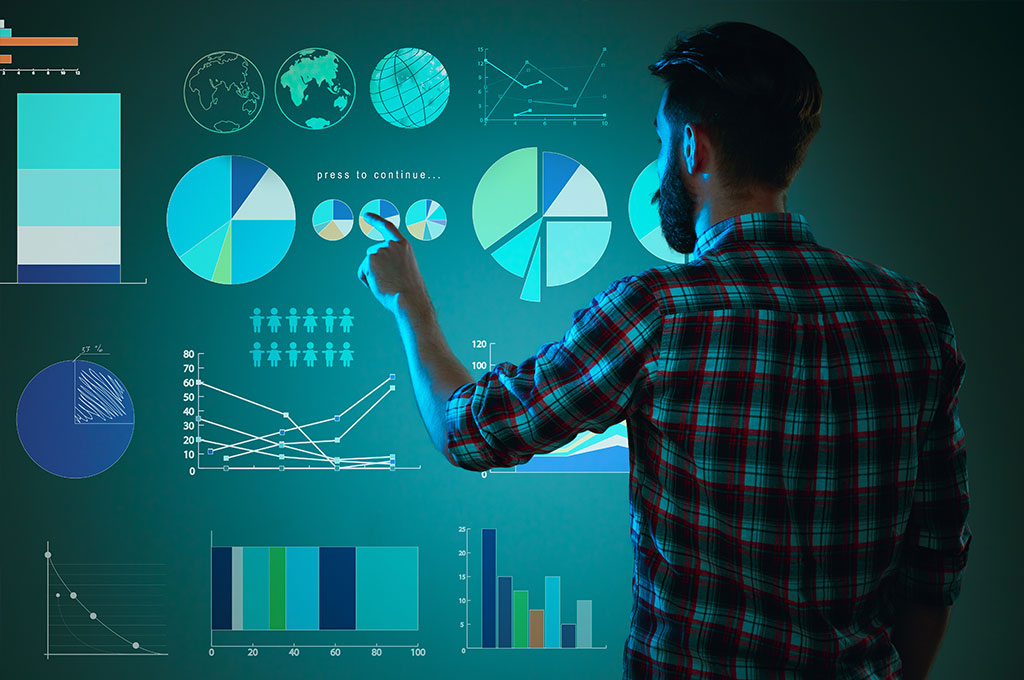
Data Visualization and Reporting involves presenting data in a visual context, such as charts, graphs, and dashboards, to help stakeholders understand complex information and make data-driven decisions. Here’s a more sophisticated breakdown

Data Modeling
The initial phase involves structuring and organizing data to ensure it is coherent and meaningful. This includes defining relationships between different data entities and creating a logical schema that reflects real-world scenarios.
- Blueprinting and Roadmap
- Rationalization and Transformation
- Modernization and Governance
- Data Migration (Cloud)
- Data Monetization
Visual Analytics
This encompasses the use of advanced visual representations to interpret data. Techniques such as heat maps, tree maps, and scatter plots are employed to unveil patterns, correlations, and outliers within the data.
Dashboarding and Scorecarding
Creating dynamic dashboards and scorecards that provide real-time insights into key performance indicators (KPIs). These tools enable decision-makers to track progress, identify trends, and monitor operational health efficiently.
Interactive Reporting
Facilitates the creation of interactive reports that allow users to drill down into specific data points, customize views, and extract detailed insights. This enhances the analytical capabilities and fosters a deeper understanding of the data.
Data Storytelling
Combining data visualization with narrative techniques to present data in a compelling and understandable manner. This approach helps convey the context and significance of the data, making it easier for stakeholders to grasp the insights.
Advanced Visualization Tools
Utilizing state-of-the-art tools such as Tableau, Power BI, and D3.js to create sophisticated visualizations. These tools provide robust features for data manipulation, customization, and sharing.
Reporting Automation
Implementing automated reporting systems that generate regular reports without manual intervention. This ensures consistency, accuracy, and saves time for data analysts.
Artificial Intelligence and Machine Learning
Employs advanced algorithms to process data, learn from it, and make intelligent decisions. These technologies are used for predictive maintenance, optimization, and automation.
Cloud Computing
Provides scalable and flexible computing resources over the internet. This supports collaboration, data storage, and processing needs without the constraints of physical hardware.

Integrating these advanced methodologies in data visualization and reporting enables organizations to harness the full potential of their data, transforming raw information into actionable insights.
Services
Offerings
Benefits
- Digital Data Platform
- Consistent Customer Experience
- Digital Ready Data Storage / Retrieval
- Quicker Turn-Around Time (TAT)
- Lower operating costs


